
This makes it all the more important to take a closer look at this business segment: Where am I well represented with my brand? Where am I not and why? Where can I exploit more potential? Asking the right questions gives you the right answers. Detailed information provides a realistic picture of the current situation and highlights the need for action in your own market. This is how sales can be optimised.
But how does such an analysis of dealer sales work in detail? Let us look at a typical example in our market analysis system MIS.

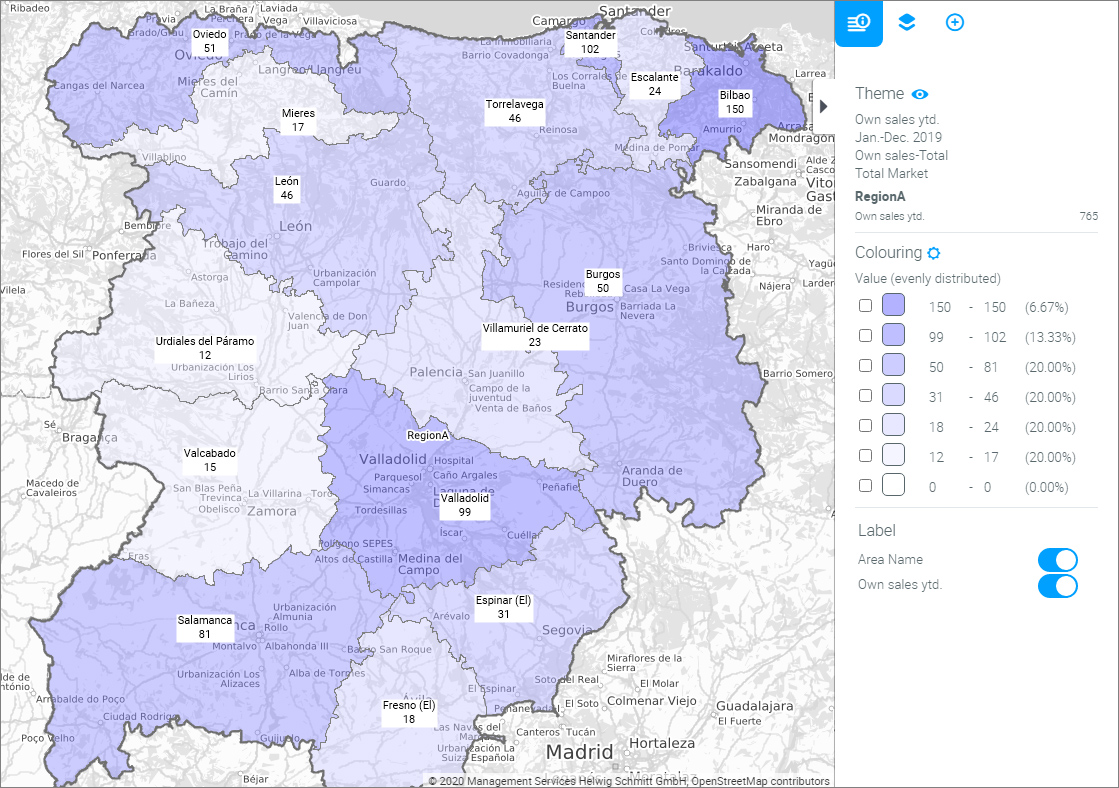
The usual starting point of a market analysis from the manufacturer's point of view is a comparison of the current situation of all dealers. Who sells above average and who below average? And which figures stand out so that a closer look is required? Let us first get an overview of the total sales figures of each dealer:
Although this information is certainly interesting, it is not sufficient on its own, for example to draw precise conclusions about the causes of low sales figures. Is a dealer exploiting all possible sales opportunities or is he losing sales to intra-brand competition? In order to narrow down the potential causes, one should first look at whether or not a dealer is focusing only on his central area of influence.
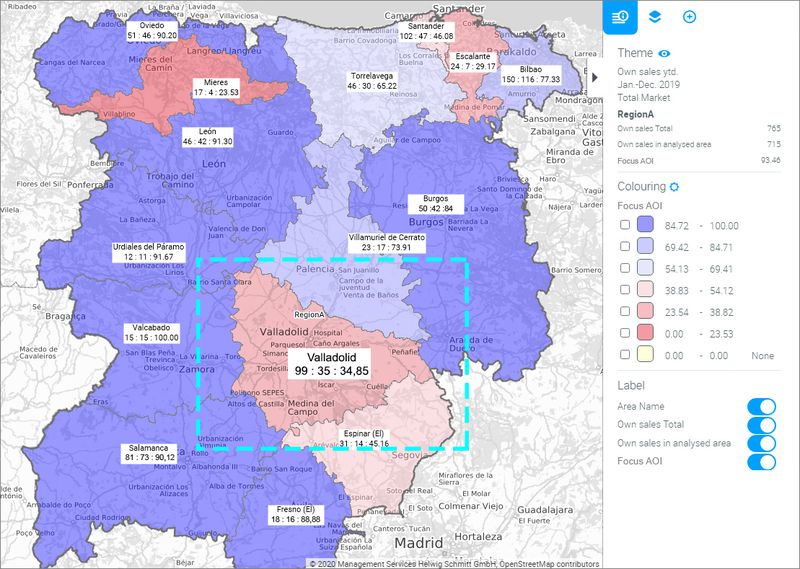
In our example, dealer "Valladolid" has sold only 35 vehicles within its area of influence out of a total of 99 vehicles sold, but 64 vehicles outside its area of influence. This means that only 34.85% of its sales are concentrated in its central area of influence. This can be, but is nevertheless a low value. Does the area really not have enough potential or is there another cause? A reason to take a closer look at this dealer.
How much of the possible sales potential does dealer Valladolid cover in its area of influence?
It is now important to assess whether dealer Valladolid is losing its sales potential to intra-brand competition or whether it has to sell outside its area of influence because it has too little potential on its own. This map shows all cars of the brand sold in relation to Valladolid's own sales. It allows us to see what proportion of total brand sales Valladolid did in its area of influence.
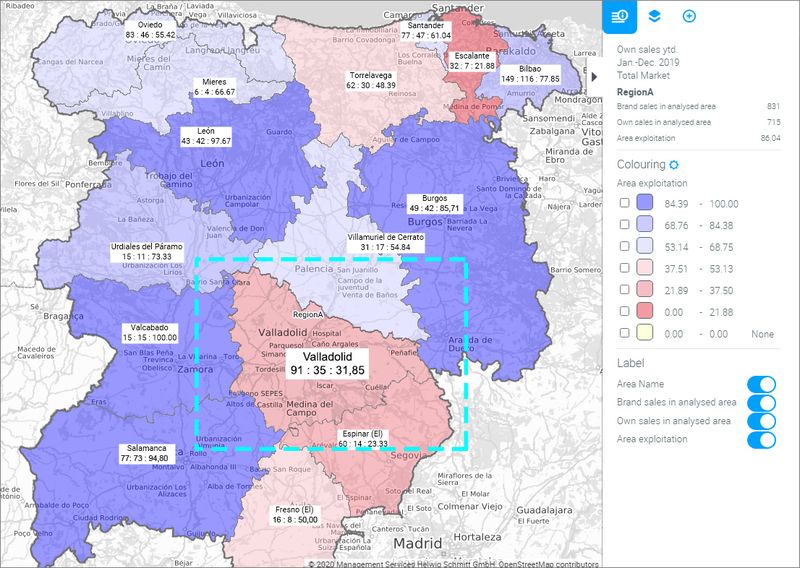
Of a total of 91 vehicles sold in Valladolid's area of influence, Valladolid itself has only sold 35. This means that 56 sales were made by other dealers. This area exploitation of only 31.85% shows that there was sales potential, but that Valladolid itself could only capture a small part of it.
There may also be several reasons for this finding. Perhaps it does not sufficiently recognise the potential, unlike its competitors, and therefore has a different sales strategy or it focuses too much on customers outside its area of influence. Or perhaps it advertises vehicle models that do not fit into its target group segment. To find out more, it is worth taking a look at the next level of sales detail: In which areas has Valladolid sold vehicles and in which parts of its area of influence has it lost sales?
1. In which areas has Valladolid sold vehicles?
This table is well suited to answer the first question. It shows not only all the areas Valladolid has sold to, but also which models have been sold:
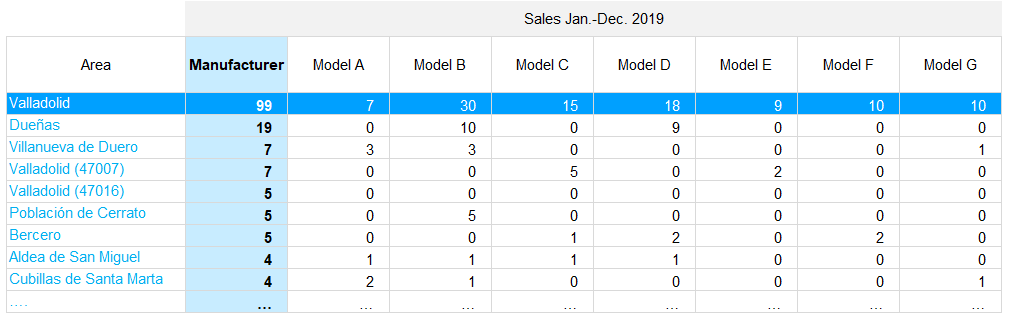
What is striking here is that Valladolid has sold a particularly large number of Model B vehicles in the Dueñas area, although this is not part of its area of influence. In addition, it has also frequently sold Model B and D vehicles there. Moreover, since the B and D models are Valladolid's best-selling models, it is likely that it promoted them more.
2. In which parts of its area of influence has Valladolid lost sales?
This map shows lost sales in the various sub-areas of Valladolid's area of influence. The figures in the labels show on the left the sales of other dealers, those on the right represent Valladolid's own sales into a sub-area.

The map shows that Valladolid sells few cars within its area of influence and even less in the outlying areas. Its competitors, on the other hand, already do so. It could therefore be that it either does not focus its sales or marketing activities sufficiently on the peripheral areas or advertises with the wrong models.
Does dealer Valladolid sell sufficient quantities of the most popular models?
This table shows in a ranking list which car models were primarily purchased in Valladolid's area of influence. It also shows how many of these vehicles Valladolid itself has sold (left column) and how many its competitors have sold (right column).

Models B, A and E are the best-selling models in the area of influence. Accordingly, they seem to be popular with customers. Dealer Valladolid, on the other hand, has sold only two units of Model B in its area of influence, although this model is one of the best-selling models overall. It is thus giving away the potential of Model B to the competition. Although Valladolid sells the A and E models within its area of influence, it is nevertheless losing sales or divesting potential to competitors in the case of these two models. Valladolid seems to focus too little on the sales and marketing of the most popular models in its area of influence.
The end of our analysis?
By examining the models, we have already been able to find a reason for Valladolid's distinct sales figures.As in most cases, there will be other causes for which additional detailed analyses are worthwhile. It would certainly be useful to take a closer look at the market situation of the competition on the basis of registrations, if this has not already been done before the analysis of dealer sales. Depending on the case, commercial sales could also be removed from the analysis to look in more detail at private customers as a target group, or socio-demographic data could be used to find out which model price ranges are suitable in a given area.
Though our example already shows how complex such an analysis can and must be it is only through this process that you can identify individual correlations and the need for optimisation. This is precisely why it is so important to work with a good data basis. Faulty and incomplete data distort the details and create an unrealistic overall picture. Therefore, ask the right questions, use qualitative data and thus get deep into your market to ensure a sound basis for your decisions.
November 2020
A good strategy requires the right basis for data. As a long-standing partner of the automotive industry, we offer you support in all aspects of your market analysis by providing consultancy and powerful market intelligence systems. Learn more about our services in the field of "Market Analysis Sales" or contact us directly.